An app for iPhone
22 stocks worth your attention
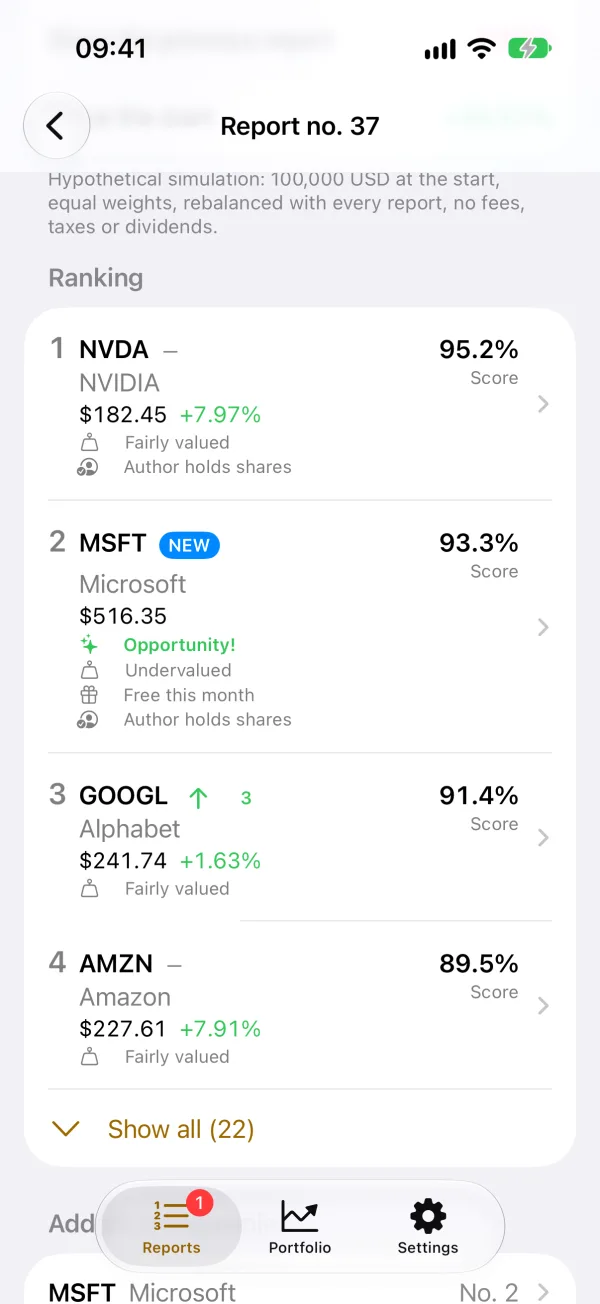
Every month, a ranking of up to 22 of the best-rated large US companies: profitability, fundamentals and valuation, a qualitative analysis and the reason for every change in the portfolio. We do the research, you make the decision.
- A new report on the 15th of every month
- Only the companies with the greatest potential according to our method
- Historical indicators straight from SEC filings
- One company of every report for free, and full access free for 7 days on the yearly plan
Why 22 companies
Around 20 companies are enough to remove most of the risk tied to a single business. Evans and Archer showed it in 1968, and later research confirms it.
An index fund (ETF) buys the whole market: good companies together with weak ones. Alpha22 picks only the companies that score best in our assessment and checks every month whether they still deserve their place. Weaker ones leave the portfolio, and you know why.
Our goal
A goal, not a promiseBeat the S&P 500 and the Nasdaq-100
We pick the companies with the greatest potential according to our method and check every month whether they still deserve their place. We want a portfolio of these companies to grow faster than the two main US market indexes.
We show our progress openly: since the first report, the app compares the hypothetical portfolio with the SPY (S&P 500) and QQQ (Nasdaq-100) ETFs, at the same prices and on the same days.
This is a goal, not a guaranteed result. The portfolio may do worse than the indexes, and investing involves the risk of losing capital.
Hard data and qualitative analysis
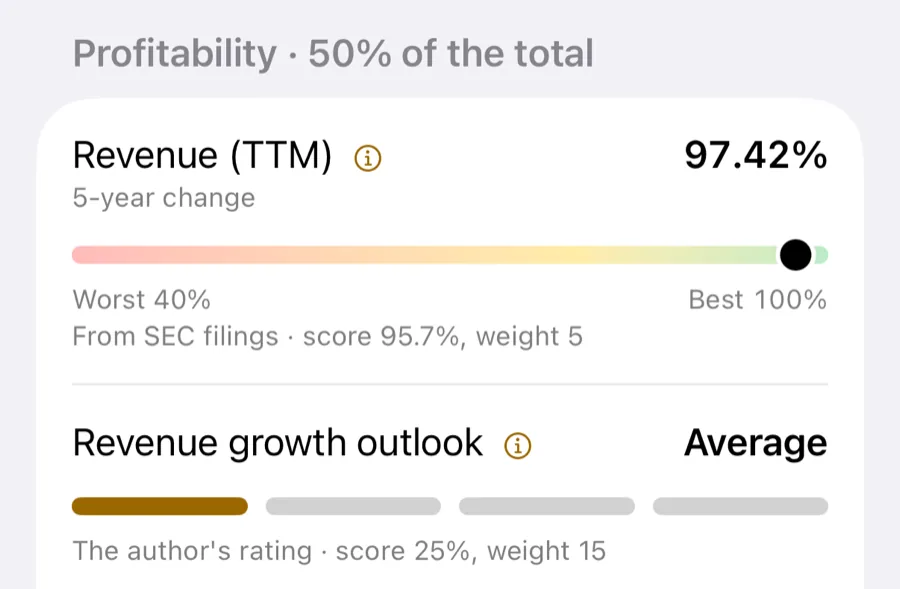
Each company is scored in three categories: profitability, fundamentals and valuation. The scores come from 10 weighted indicators: 5 historical ones are computed from the financial statements filed with the SEC, and 5 forward-looking ones are rated by the author. Every score has a published scale, so you can check it.
Profitability weighs the most: it is half of the total score. Over the long term, share prices tend to follow a company's earnings, so we look for companies that earn well and keep earning more. We leave out companies at risk of bankruptcy and extremely expensive ones.
On top of that comes a qualitative analysis: 21 questions about the industry, product, competitive advantage, customers, risks and management, with answers and points. Companies are ranked by their total score.
Only large, proven companies
We check over 1,000 companies listed in the US and consider only the large ones. They are liquid, well covered by analysts and usually more stable than small businesses.
More analyses make the data easier to verify, and the risk of bankruptcy of such companies is usually lower.
See how the portfolio performs
The app tracks a hypothetical portfolio: 100,000 USD at the first report, equal weights and full rebalancing at every publication, with fractional shares.
Fees, taxes and dividends are ignored. The portfolio is revalued a few times a month from public quotes and compared with the S&P 500 (SPY) and the Nasdaq-100 (QQQ).
Pricing
The free version lets you get to know the app. A subscription unlocks the full reports.
Free
0 USD
One company of every report with its full analysis, the ranking with scores and the portfolio result.
Monthly
9.99 USD per month
Every report, full analyses, current company prices and the simulated trades.
Annual
79.99 USD per year
The same as monthly, for less, with a 7-day free trial.
Apple handles payments, cancellations and refunds. Prices are for the US App Store. In other countries the App Store shows prices in local currency.
Frequently asked questions
Is this investment advice?
No. The reports are the same for everyone and do not take your financial situation into account. They are information only; you make your investment decisions yourself.
When do reports come out?
On the 15th of every month. The app can notify you about a new report.
Where does the data come from?
Historical indicators are computed from the financial statements companies file with the U.S. SEC. Analysts' estimates and price targets are rated by the author from publicly available information, including sites such as Yahoo Finance, Investing.com, MarketWatch, Nasdaq.com, TipRanks, Zacks, MarketBeat, Seeking Alpha and Stock Analysis. The author uses AI tools to search the web and these sites and to help assess the data found. The report gives the author's rating, not the values from these sites. The author enters prices from public quotes. The methodology has the details.
Does the author hold shares of the companies in the reports?
Yes, of some of them. Such companies are marked in the report, and every report states the author, when it was prepared and published, and each company's rank history for the last 12 months.
What data does the app collect?
None. There are no accounts and no analytics. The subscription is checked with the signed App Store transaction, which is not stored.
How do I cancel the subscription?
In your Apple Account settings on iPhone (Settings → your name → Subscriptions) or in the app: Settings → Manage subscription.
What does the free version include?
The full analysis of one company of every report, the ranking with the scores of the other companies, the number of portfolio changes and the simulation result.